

Featured Case Studies
Case Studies
Most companies rely on paid representatives and polished testimonials. We invite you to inspect the business itself. Explore real video case studies, live store dashboards refreshed on screen, month-by-month performance reports, and detailed client case studies from active partners. We don’t just tell you the results—we show you how the stores actually performed, including both the highs and the inevitable challenges of running a real business. If you’d like to conduct additional due diligence, we can provide FTC disclosures, supporting documentation, and business verification materials that substantiate the success stories presented throughout these case studies, along with qualified client referrals upon request.
Featured Case Studies
Case Studies
Most companies rely on paid representatives and polished testimonials. We invite you to inspect the business itself. Explore real video case studies, live store dashboards refreshed on screen, month-by-month performance reports, and detailed client case studies from active partners. We don’t just tell you the results—we show you how the stores actually performed, including both the highs and the inevitable challenges of running a real business. If you’d like to conduct additional due diligence, we can provide FTC disclosures, supporting documentation, and business verification materials that substantiate the success stories presented throughout these case studies, along with qualified client referrals upon request.
REAL CLIENTS. REAL Results. NO FANCY STUDIO.
Video Case Studies
REAL CLIENTS. REAL Results.
NO FANCY STUDIO.
Video Case Studies
Learn More
In this store, we're showing you a full year of real sales. One of the accounts we operate — about $1M over 12 months, walked through month by month. Real dashboard, dips and all, including two slower months while we worked through a supplier issue.
Learn More
In this store review, we're showing you three accounts we operate — live, side by side. Real dashboards: one store at ~$739K lifetime, another past $1.5M, a third at $545K year-to-date. Month by month, ebbs and flows and all — including a client currently pausing to take payouts instead of reinvesting.
Learn More
In this store review, we're showing you two accounts we operate — with the real P&Ls on screen. One store we've managed ~18 months at about $1M in trailing-year sales, and a second at ~$651K over the year ($310K year-to-date). Month by month, real dashboards — including the slower stretches where clients chose to ease sales to keep their accounts protected during a supplier issue.
Learn More
In this store, we're showing you one of our larger accounts — live, with the numbers on screen. A store that's been with us a few years, running roughly $1.13M in sales across a four-month Q4 stretch and a ~$398K single month. Real dashboard, day-by-day and month-by-month — including a client who pays themselves a salary straight out of the account.
Learn More
In this store, we're showing you one of our Walmart accounts — with the P&L on screen. A store we've run since January of last year — about $271K in sales over roughly 16 months, walked through month by month on the real dashboard. Steady, consistent months across the back half of the year.
Learn More
In this store review, we're showing you three of our TikTok Shop accounts in their early months. Newer stores we started running last fall — real dashboards, month by month as they warm up: one at ~$25K in sales since September, another at ~$11K since December, a third at ~$15K since October. An honest look at what the ramp phase actually looks like.
Learn More
In this walkthrough, we're showing you the kinds of products we actually sell — line by line. A look inside a real client store's catalog and the tracking dashboard you'd get access to: everyday high-volume staples like receipt paper, canned goods, emergency water, and bundled consumables. Real products, real units moving — the unglamorous, repeatable inventory that keeps a store selling.
Learn More
In this store review, we're showing you three accounts at different stages — so you can see how stores mature. All three with real dashboards and P&Ls on screen: one two-year store at ~$2.18M in total sales, one at ~$403K about a year and a half in, and a third under a year old at ~$111K and just starting to ramp. A side-by-side look at what the first year, the year-and-a-half mark, and the two-year-plus stage actually look like.
Learn More
In this store review, we're showing you three live accounts — refreshed on screen so you know they're real. All three with real dashboards: a store ~20 months in running ~$120K last month, one about a year and a half at ~$96K last month, and one just over a year old at ~$500K+ year-to-date, currently running lighter while the client focuses on other ventures. Real numbers, ebbs and flows and all.
Learn More
In this walkthrough, we’re taking you inside one real client store and reviewing its performance month by month over the past year. You’ll see live dashboard data refreshed on screen, including periods of rapid growth, seasonal fluctuations, and temporary supplier challenges—providing an honest look at how a professionally managed store performs over time. Real numbers, real performance, and full transparency.
Learn More
In this store, we're showing you a full year of real sales. One of the accounts we operate — about $1M over 12 months, walked through month by month. Real dashboard, dips and all, including two slower months while we worked through a supplier issue.
Learn More
In this store review, we're showing you three accounts we operate — live, side by side. Real dashboards: one store at ~$739K lifetime, another past $1.5M, a third at $545K year-to-date. Month by month, ebbs and flows and all — including a client currently pausing to take payouts instead of reinvesting.
Learn More
In this store review, we're showing you two accounts we operate — with the real P&Ls on screen. One store we've managed ~18 months at about $1M in trailing-year sales, and a second at ~$651K over the year ($310K year-to-date). Month by month, real dashboards — including the slower stretches where clients chose to ease sales to keep their accounts protected during a supplier issue.
Learn More
In this store, we're showing you one of our larger accounts — live, with the numbers on screen. A store that's been with us a few years, running roughly $1.13M in sales across a four-month Q4 stretch and a ~$398K single month. Real dashboard, day-by-day and month-by-month — including a client who pays themselves a salary straight out of the account.
Learn More
In this store, we're showing you one of our Walmart accounts — with the P&L on screen. A store we've run since January of last year — about $271K in sales over roughly 16 months, walked through month by month on the real dashboard. Steady, consistent months across the back half of the year.
Learn More
In this store review, we're showing you three of our TikTok Shop accounts in their early months. Newer stores we started running last fall — real dashboards, month by month as they warm up: one at ~$25K in sales since September, another at ~$11K since December, a third at ~$15K since October. An honest look at what the ramp phase actually looks like.
Learn More
In this walkthrough, we're showing you the kinds of products we actually sell — line by line. A look inside a real client store's catalog and the tracking dashboard you'd get access to: everyday high-volume staples like receipt paper, canned goods, emergency water, and bundled consumables. Real products, real units moving — the unglamorous, repeatable inventory that keeps a store selling.
Learn More
In this store review, we're showing you three accounts at different stages — so you can see how stores mature. All three with real dashboards and P&Ls on screen: one two-year store at ~$2.18M in total sales, one at ~$403K about a year and a half in, and a third under a year old at ~$111K and just starting to ramp. A side-by-side look at what the first year, the year-and-a-half mark, and the two-year-plus stage actually look like.
Learn More
In this store review, we're showing you three live accounts — refreshed on screen so you know they're real. All three with real dashboards: a store ~20 months in running ~$120K last month, one about a year and a half at ~$96K last month, and one just over a year old at ~$500K+ year-to-date, currently running lighter while the client focuses on other ventures. Real numbers, ebbs and flows and all.
Learn More
In this walkthrough, we’re taking you inside one real client store and reviewing its performance month by month over the past year. You’ll see live dashboard data refreshed on screen, including periods of rapid growth, seasonal fluctuations, and temporary supplier challenges—providing an honest look at how a professionally managed store performs over time. Real numbers, real performance, and full transparency.
Featured Case Studies
Real Case Studies From Real Clients
Three Amazon Stores
Case Study 1
More About
Case Study 1
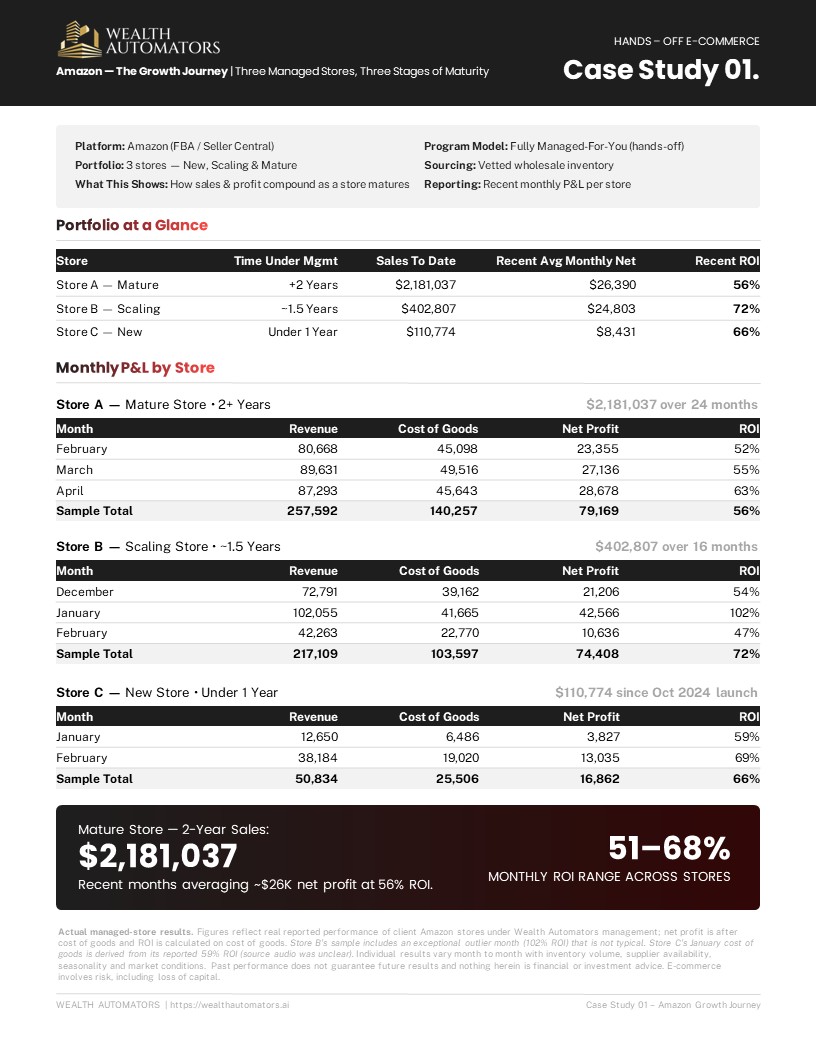
In this case study, we're showing you three managed Amazon stores at three stages of maturity. A two-year store at ~$2.18M in sales to date, a scaling store at ~$403K about 18 months in, and a new store under a year old at ~$111K — with monthly revenue, cost of goods, and net profit laid out per store. A clear look at how a store compounds as it matures.
HIgh Volume Ebay Store
Case Study 2
More About
Case Study 2
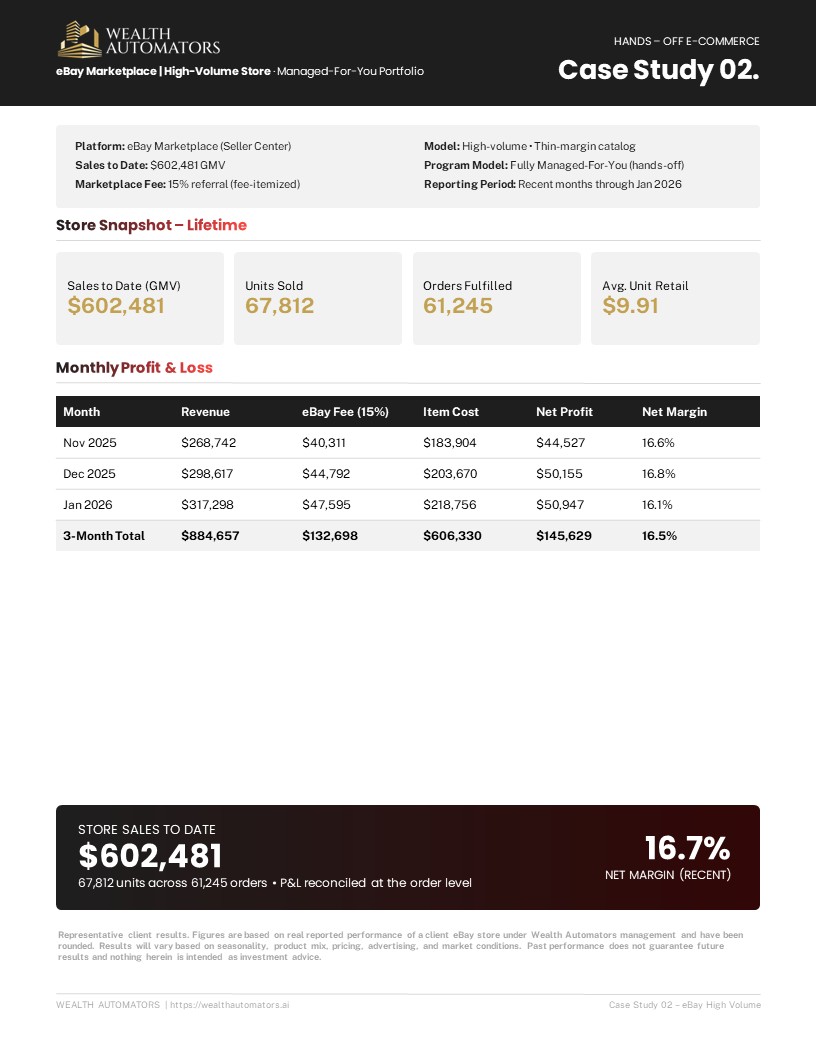
In this case study, we’re showing you a high-volume eBay Marketplace store. Over $602,481 in lifetime sales across 67,812 units sold and 61,245 orders fulfilled — a thin-margin, high-volume catalog with monthly revenue, marketplace fees, product costs, and net profit broken down line by line. A transparent look at how a professionally managed e-commerce store performs at scale.
HIgh Volume Walmart Store
Case Study 3
More About
Case Study 3
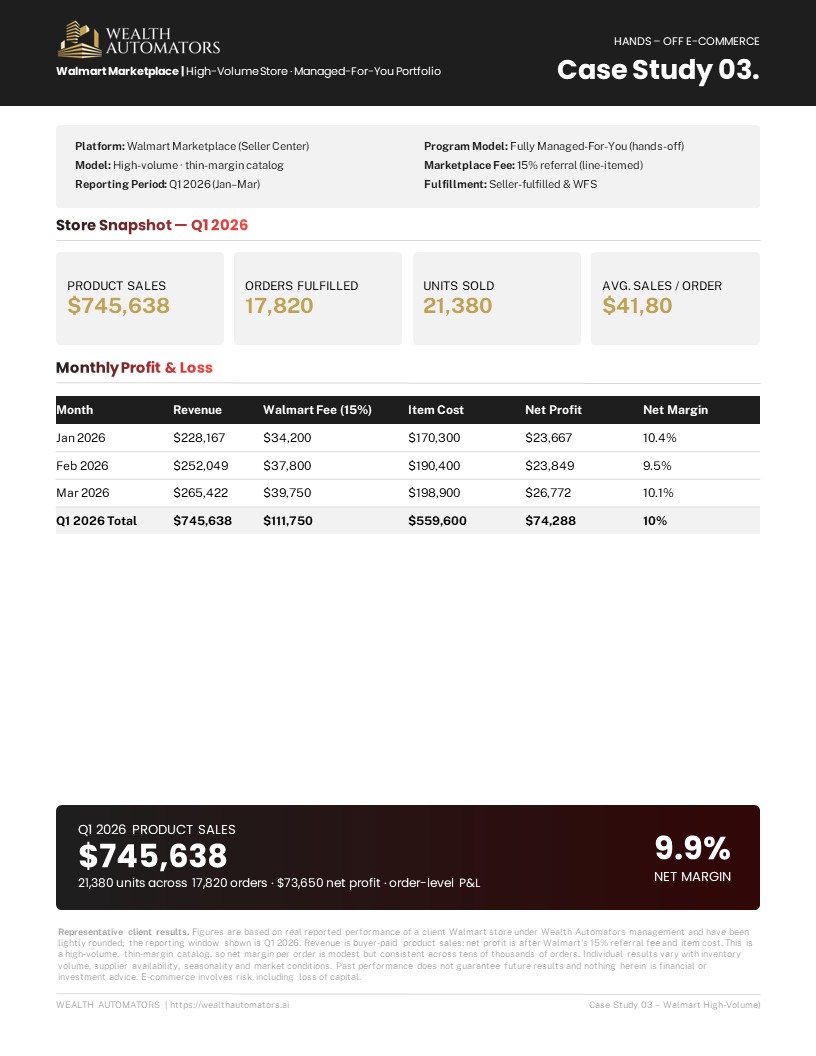
In this case study, we're showing you a high-volume Walmart Marketplace store's Q1 2026 performance. $745,000 in product sales across 21,380 units and 17,820 orders in a single quarter (January–March) — a thin-margin, high-turn catalog with monthly revenue, Walmart fees, item cost, and net profit laid out line by line. A clear look at what a high-volume store does at quarterly scale.
High Volume TikTok Shop
Case Study 4
More About
Case Study 4
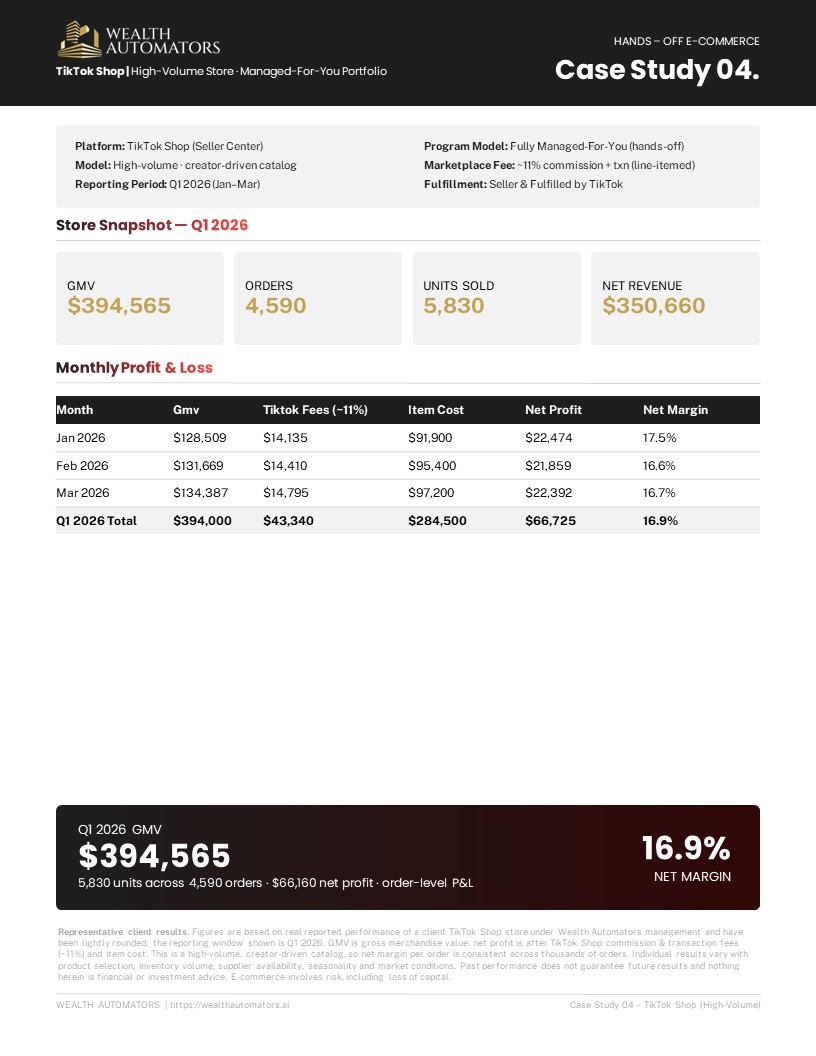
In this case study, we're showing you a high-volume TikTok Shop store's Q1 2026 performance. $394,000 in GMV across 5,830 units and 4,590 orders in a single quarter (January–March), with $350,660 in net revenue — a creator-driven catalog with monthly GMV, TikTok fees, item cost, and net profit laid out line by line. A clear look at how a TikTok Shop store performs at scale.
HIgh Volume Walmart Store
Case Study 5
More About
Case Study 5
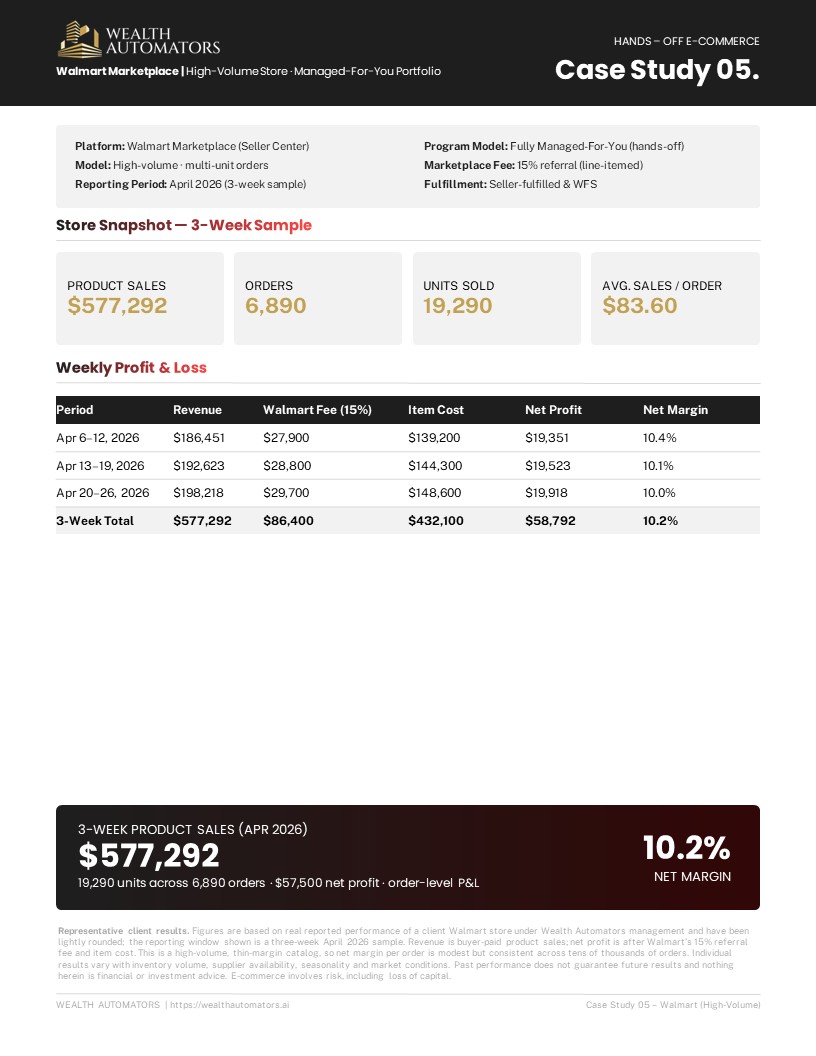
In this case study, we're showing you a high-volume Walmart Marketplace store over a 3-week sample. $576,000 in product sales across 19,290 units and 6,890 orders in just three weeks of April 2026 — a high-volume, multi-unit catalog with weekly revenue, Walmart fees, item cost, and net profit laid out line by line. A clear look at the pace a high-volume store can run at.
Top Amazon Store
Case Study 6
More About
Case Study 6
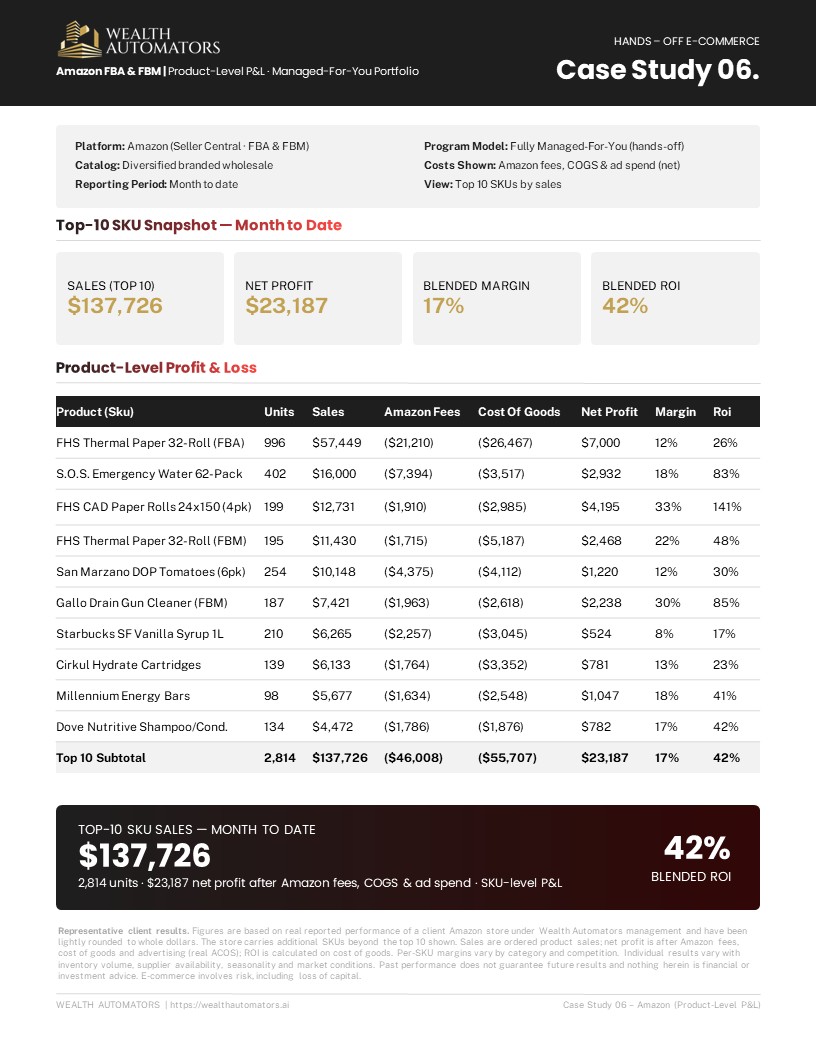
In this case study, we're showing you a real store's top-10 products, line by line. $137,726 in sales from the top SKUs in a single month — everyday high-turn staples like thermal receipt paper, emergency water, canned goods, and bundled consumables, each with units sold, Amazon fees, cost of goods, and net profit laid out. A clear look at the kind of unglamorous, repeatable inventory that actually moves.
Mature Amazon Store
Case Study 7
More About
Case Study 7
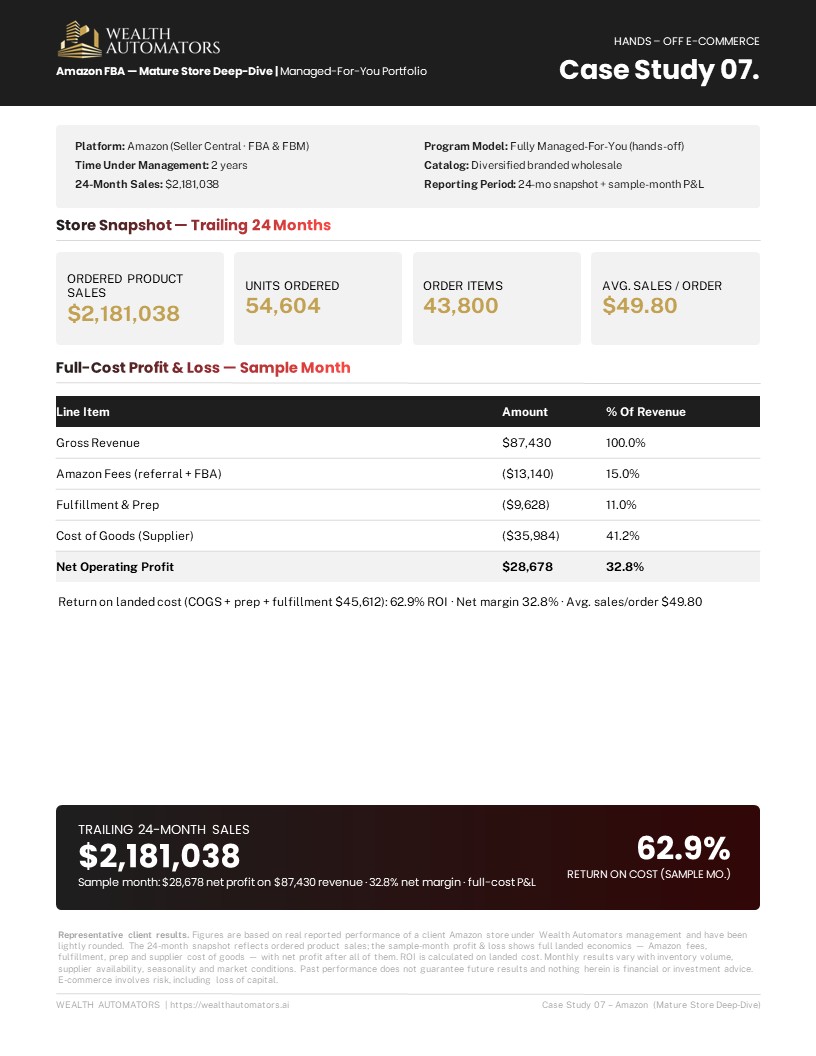
In this case study, we're showing you a deep-dive on a mature Amazon store — with full-cost economics on the page. $612,487 in sales over its trailing 24 months across 118,932 units, plus a sample-month P&L that breaks down every line: gross revenue, Amazon fees, fulfillment and prep, and cost of goods, down to net operating profit. A clear look at what a two-year store's real, fully-loaded numbers look like.
Three Amazon Stores
Case Study 8
More About
Case Study 8
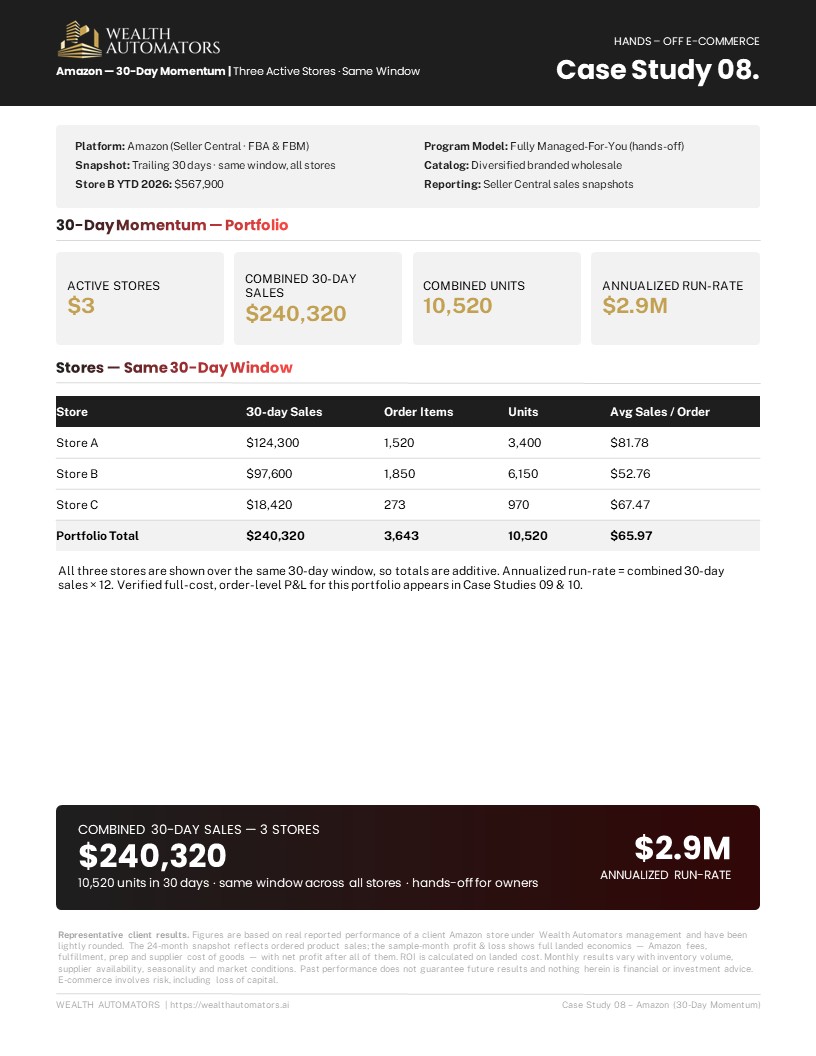
In this case study, we're showing you three active Amazon stores over the same 30-day window. $240,320 in combined sales across 10,520 units in a single month — three stores side by side (one at ~$124K, one at ~$97K, one at ~$18K), with order items, units, and average sale per order for each. A clear snapshot of what a portfolio of managed stores does in one month.
Five Amazon Stores
Case Study 9
More About
Case Study 9
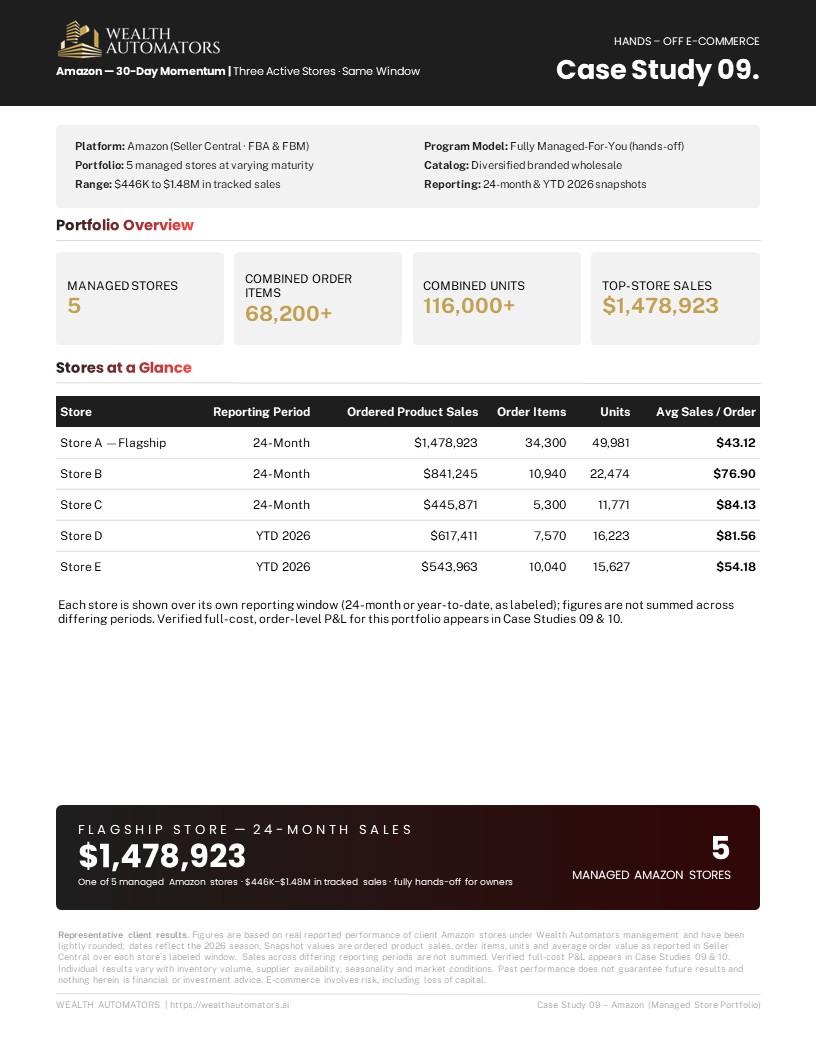
In this case study, we're showing you a portfolio of five managed Amazon stores at varying maturity. Tracked sales ranging from ~$446K to ~$1.48M per store, across 116,000+ combined units and 68,200+ order items — each store shown with its own reporting period, sales, units, and average sale per order. A clear look at what a multi-store managed portfolio looks like across different stages.
Featured Case Studies
Real Case Studies
From Real Clients
Three Amazon Stores
Case Study 1
More About
Case Study 1
In this case study, we're showing you three managed Amazon stores at three stages of maturity. A two-year store at ~$2.18M in sales to date, a scaling store at ~$403K about 18 months in, and a new store under a year old at ~$111K — with monthly revenue, cost of goods, and net profit laid out per store. A clear look at how a store compounds as it matures.
HIgh Volume Ebay Store
Case Study 2
More About
Case Study 2
In this case study, we’re showing you a high-volume eBay Marketplace store. Over $602,481 in lifetime sales across 67,812 units sold and 61,245 orders fulfilled — a thin-margin, high-volume catalog with monthly revenue, marketplace fees, product costs, and net profit broken down line by line. A transparent look at how a professionally managed e-commerce store performs at scale.
HIgh Volume Walmart Store
Case Study 3
More About
Case Study 3
In this case study, we're showing you a high-volume Walmart Marketplace store's Q1 2026 performance. $745,000 in product sales across 21,380 units and 17,820 orders in a single quarter (January–March) — a thin-margin, high-turn catalog with monthly revenue, Walmart fees, item cost, and net profit laid out line by line. A clear look at what a high-volume store does at quarterly scale.
High Volume TikTok Shop
Case Study 4
More About
Case Study 4
In this case study, we're showing you a high-volume TikTok Shop store's Q1 2026 performance. $394,000 in GMV across 5,830 units and 4,590 orders in a single quarter (January–March), with $350,660 in net revenue — a creator-driven catalog with monthly GMV, TikTok fees, item cost, and net profit laid out line by line. A clear look at how a TikTok Shop store performs at scale.
HIgh Volume Walmart Store
Case Study 5
More About
Case Study 5
In this case study, we're showing you a high-volume Walmart Marketplace store over a 3-week sample. $576,000 in product sales across 19,290 units and 6,890 orders in just three weeks of April 2026 — a high-volume, multi-unit catalog with weekly revenue, Walmart fees, item cost, and net profit laid out line by line. A clear look at the pace a high-volume store can run at.
Top Amazon Store
Case Study 6
More About
Case Study 6
In this case study, we're showing you a real store's top-10 products, line by line. $137,726 in sales from the top SKUs in a single month — everyday high-turn staples like thermal receipt paper, emergency water, canned goods, and bundled consumables, each with units sold, Amazon fees, cost of goods, and net profit laid out. A clear look at the kind of unglamorous, repeatable inventory that actually moves.
Mature Amazon Store
Case Study 7
More About
Case Study 7
In this case study, we're showing you a deep-dive on a mature Amazon store — with full-cost economics on the page. $612,487 in sales over its trailing 24 months across 118,932 units, plus a sample-month P&L that breaks down every line: gross revenue, Amazon fees, fulfillment and prep, and cost of goods, down to net operating profit. A clear look at what a two-year store's real, fully-loaded numbers look like.
Three Amazon Stores
Case Study 8
More About
Case Study 8
In this case study, we're showing you three active Amazon stores over the same 30-day window. $240,320 in combined sales across 10,520 units in a single month — three stores side by side (one at ~$124K, one at ~$97K, one at ~$18K), with order items, units, and average sale per order for each. A clear snapshot of what a portfolio of managed stores does in one month.
Five Amazon Stores
Case Study 9
More About
Case Study 9
In this case study, we're showing you a portfolio of five managed Amazon stores at varying maturity. Tracked sales ranging from ~$446K to ~$1.48M per store, across 116,000+ combined units and 68,200+ order items — each store shown with its own reporting period, sales, units, and average sale per order. A clear look at what a multi-store managed portfolio looks like across different stages.
CASE STUDIES
Client Testimonials
Client Testimonials
Check Out What Some Of Our Clients Are Saying About Wealth Automators


Results from our multiple client stores
Verified Store Performance
Screenshots from active partner stores. Individual results vary; not a guarantee of future performance. FTC disclosures, supporting documentation, and business verification materials that substantiate the success stories presented throughout these case studies, along with qualified client referrals upon request.
Results from our multiple client stores
Verified Store Performance
Screenshots from active partner stores. Individual results vary; not a guarantee of future performance. FTC disclosures, supporting documentation, and business verification materials that substantiate the success stories presented throughout these case studies, along with qualified client referrals upon request.


44.7% AVG ROI In 2025
2026 FTC Earnings Claim Verification
Every earnings claim featured on this website is supported by documentation prepared in accordance with the FTC Business Opportunity Rule. This packet includes our required disclosures, earnings claim statements, supporting materials used to substantiate the results presented throughout our case studies, and contact information for qualified client referrals. The complete document is available upon request as part of our due diligence process.
44.7% AVG ROI In 2025
2026 FTC Earnings Claim Verification
Every earnings claim featured on this website is supported by documentation prepared in accordance with the FTC Business Opportunity Rule. This packet includes our required disclosures, earnings claim statements, supporting materials used to substantiate the results presented throughout our case studies, and contact information for qualified client referrals. The complete document is available upon request as part of our due diligence process.
US Operations
2026 Business Verification Packet
We believe transparency should extend beyond marketing. Our Business Verification Packet includes company registration records, federal and state business verification, banking verification, and additional credentials to help prospective partners independently verify our business. The complete packet is available upon request.

US Operations
2026 Business Verification Packet
We believe transparency should extend beyond marketing. Our Business Verification Packet includes company registration records, federal and state business verification, banking verification, and additional credentials to help prospective partners independently verify our business. The complete packet is available upon request.
Ready To Explore The Partnership?
Ready To Explore The Partnership?
We help you own stores on eBay and Walmart while we run strategy, sourcing, listings, supplier coordination, fulfillment support, and customer service. You stay at a high level, similar to how you might work with a portfolio manager or advisor.
Copyright 2026 | Wealth Automators